
Are you reporting on data from a ton of different sources like SEO and PPC and getting exhausted? I know I was before I came across Supermetrics.
Supermetrics is an ETL (Extract-Transform-Load) tool that pulls data from your marketing sources into one cohesive place to report from.
Rather than logging into Facebook, then opening LinkedIn, then opening Google Analytics, you can open one Google Sheet and see all of the data you want right in front of you.
I’m sure your business is unique so the great news is that you can customize it however you’d like to show the data.
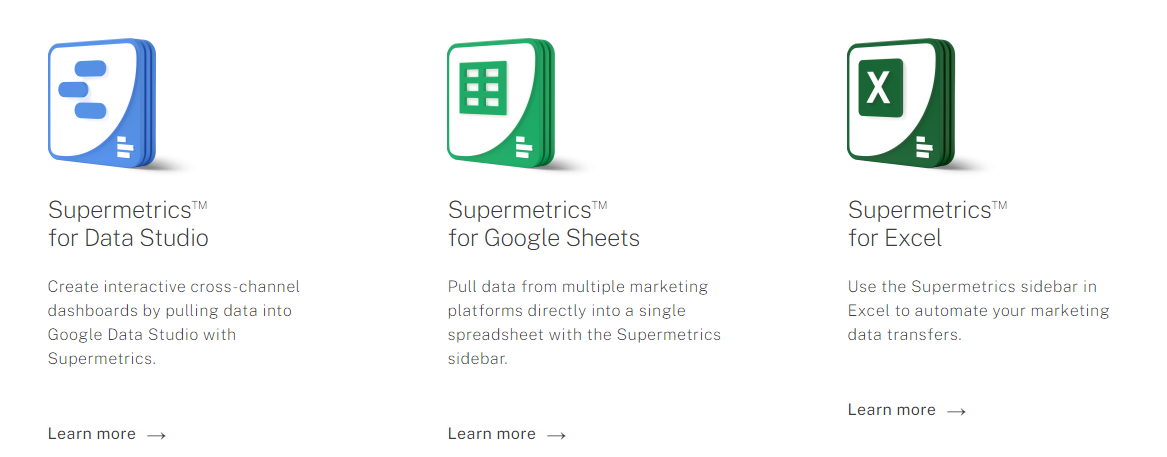
The most common uses for local digital marketing agencies are Data Studio and Google Sheets. We use the Google Sheets version of Supermetrics, so I’ll be running through how this version works.
Table of Contents
- How to Set up Supermetrics for Google Sheets
- How does Supermetrics work?
- How to Use Supermetrics to report on your data
- How much does Supermetrics cost?
- What integrations are there for Supermetrics?
- SuperMetrics Alternatives
- Additional Frequently Asked Questions
How to Set up Supermetrics for Google Sheets
Using Supermetrics for Google Sheets is not the most intuitive when you start, so I’ll explain what I’ve found through trial, error, and chatting with their support.
First, begin by creating a new Google Sheet.
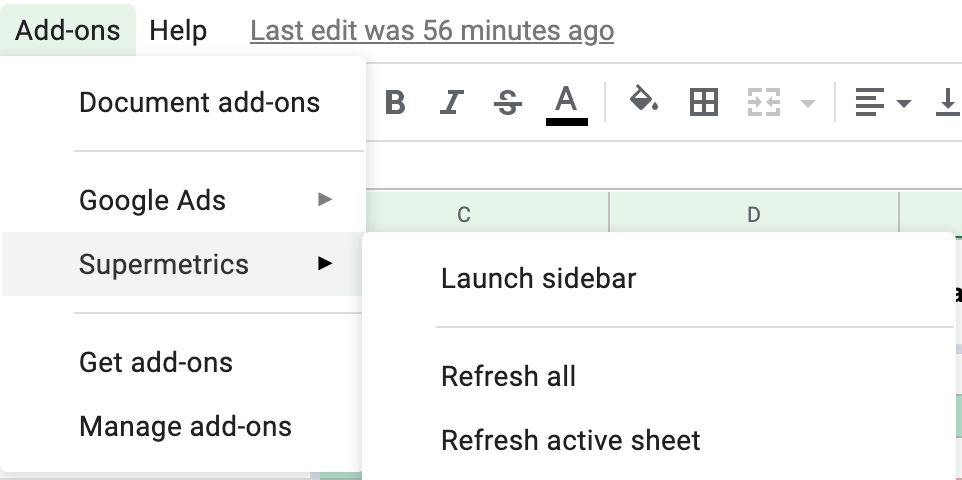
You’ll want to add the integration in the Add-ons section in the top navigation. Sign in using your credentials, and you’re off.
When first starting, I recommend testing the power of the integration by using Google Sheets for each integration you use.
If you’re looking to use Google Analytics, you’ll be able to create a sheet for each section you want to report on. For example, you can create sheets for:
- Users, sessions, bounce rate, average time on page, etc
- Landing pages
- Page speed
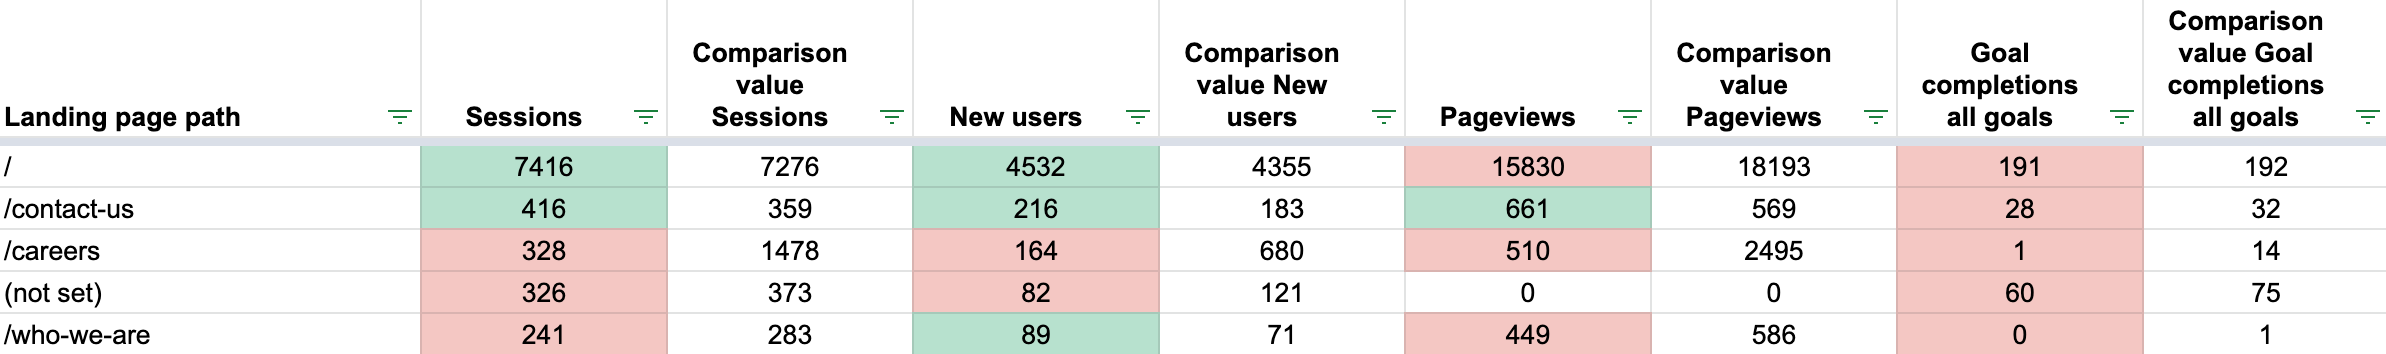
An example would look like this. You can see the path of the landing page as our starting dimension. Then, we report on how many sessions, new users, page views, and goals are completed.
To make it easier to see at a glance, I’ve added conditional formatting to display red or green whenever a column is greater or less than the comparison value.
You can take visualization a step further by selecting the desired data and inserting a chart.
For my purposes, I like having a set of data that I can open in a spreadsheet and have it automatically populate with the most recent data.
Using Templates in Supermetrics
The simplest way to get started is to create a template. You can launch the Template Gallery from the Supermetrics section of Add-ons.
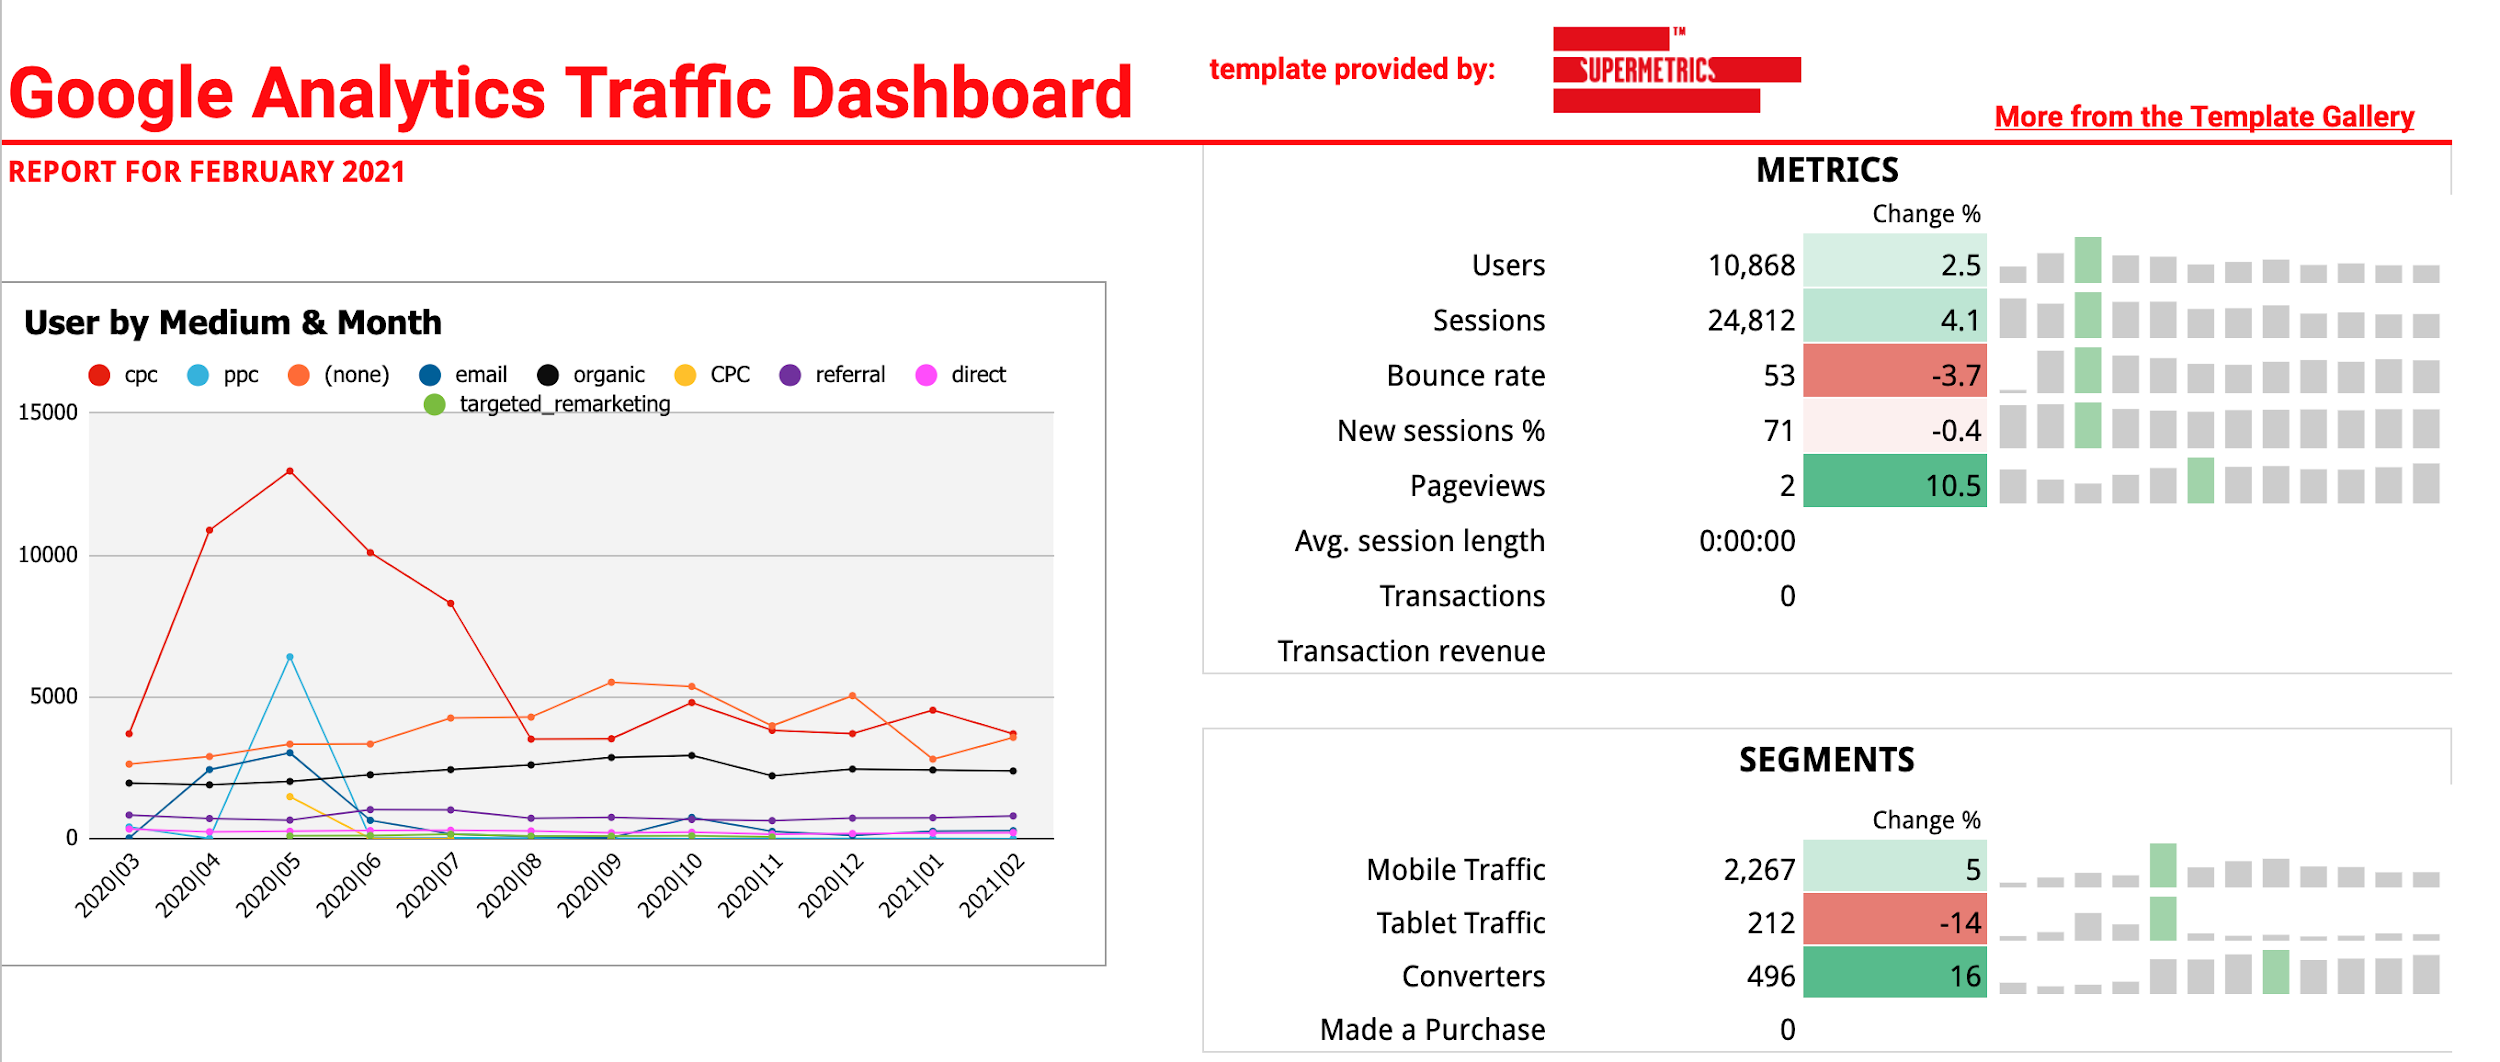
Here’s a snapshot of a Google Analytics Traffic dashboard that was created in seconds.
I can visually see users and sessions have increased a few percentage points while my bounce rate has dropped. Nice!
How does Supermetrics work?
Supermetrics pulls in your live data from advertising and analytics platforms such as Facebook and Google ads. You won’t see the data as close to real-time as possible unless you’re on one of the higher-tiered plans.
We use the Super Pro plan because we like to ensure that our data is fresh when we check it in the morning.
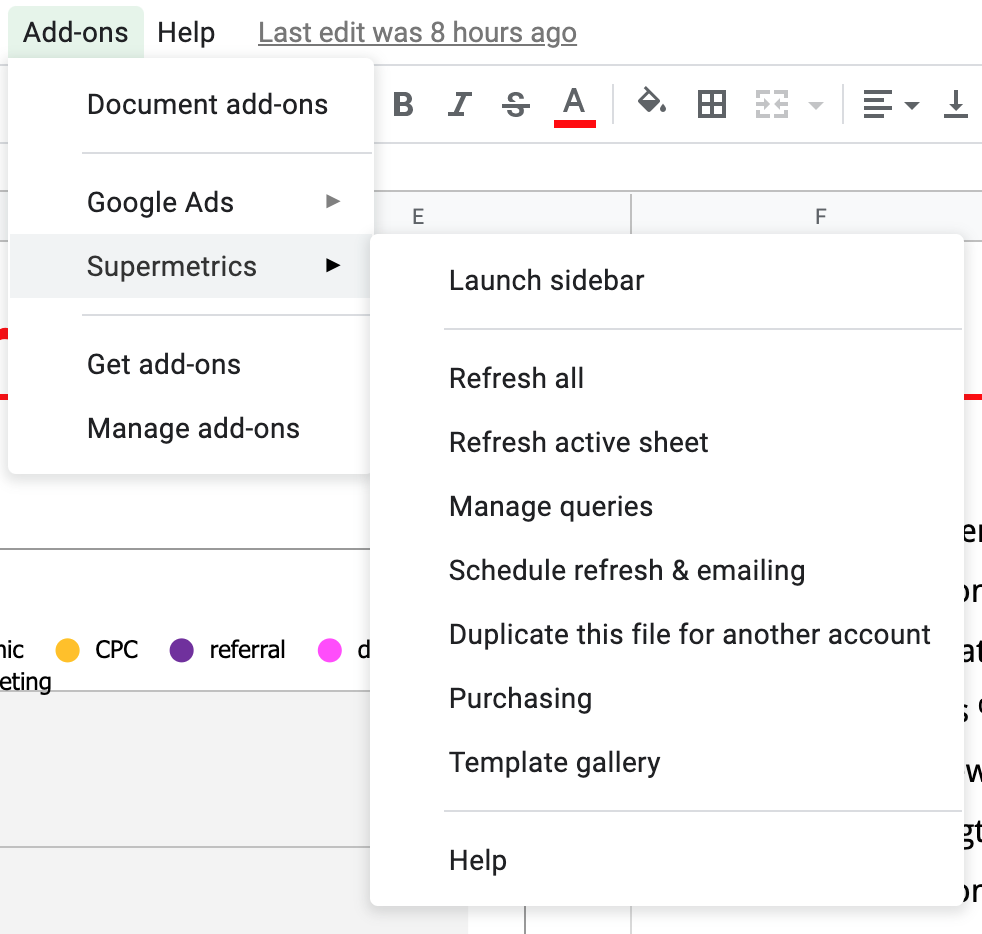
You can set it up to automatically refresh your data by going to Add-ons → Supermetrics → Refresh all or Refresh active sheet.
 .
.
When setting up your reports in Google Sheets, be sure to check your data matches up with the platform you’re reporting from. If you’re setting up Google Analytics, first check that the date range is in sync with the range you’re using in SuperMetrics.
I like to start by having both the dashboard I’m syncing data from open and the Google Sheet. This way, I can see if I had 1,000 users in my time range on Facebook, then I want to make sure I have 1,000 users being pulled into my Google Sheets report within the same range of time.
How to Use Supermetrics to report on your data?
Supermetrics allows you to pull in the data from specific sources, like Hubspot, to see them all in a cohesive place.
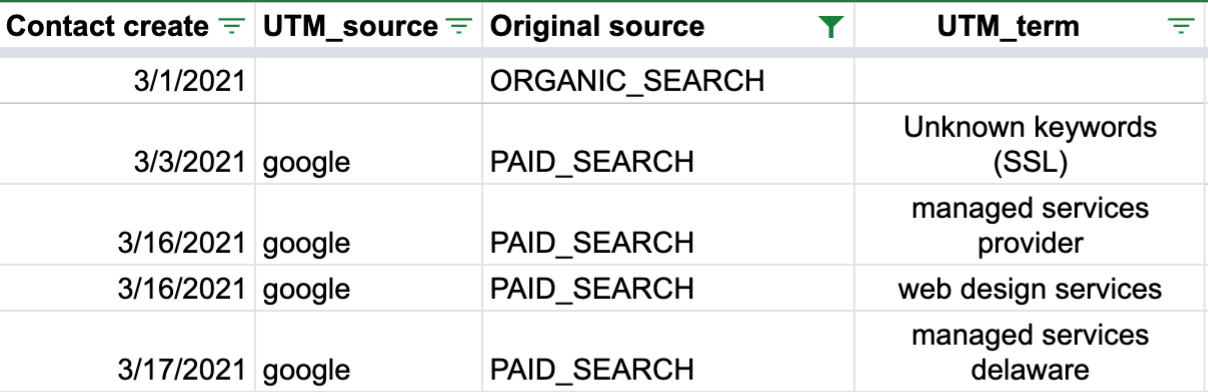
In this screenshot, we’ve pulled in the data from Hubspot based on form submissions. We can see:
- The date the contact was created in Hubspot
- The UTM Source as we’ve defined it
- The Original Source (a default Hubspot property)
- The UTM term of the keyword we’re bidding on
There are additional columns I’ve included in this report to give context to the data, such as:
- First name
- Last name
- Phone Number
- How many form submissions
- A link to their contact record in Hubspot
Seeing all of this data without having to open Hubspot and wait for it to load is super valuable. The last bullet point is super important for us for several reasons.
Let’s say we’re presenting a report to our client, and they see a name pop up that they recognize. They may say, “oh, that lead came from Google Ads? They became a customer last week. Let’s see more data on how they came in.”
You can then click the link to their contact record in Hubspot and view more detail on the customer’s timeline to see what pages they viewed, which specific ad they clicked, and which campaign they came from.
The value of SuperMetrics is being able to act on the data rather than just creating pretty reports.
How much does Supermetrics cost?
Supermetrics is not the cheapest for reporting on your data, but it’s not the most expensive either.
The Pro plan allows you to pull in data with a weekly refresh of your data. This is a good option for marketers who check their reports once a week. It can be a little frustrating if you want to check on something mid-week before it refreshes, but you can always force the reports to refresh if you need to see the data.
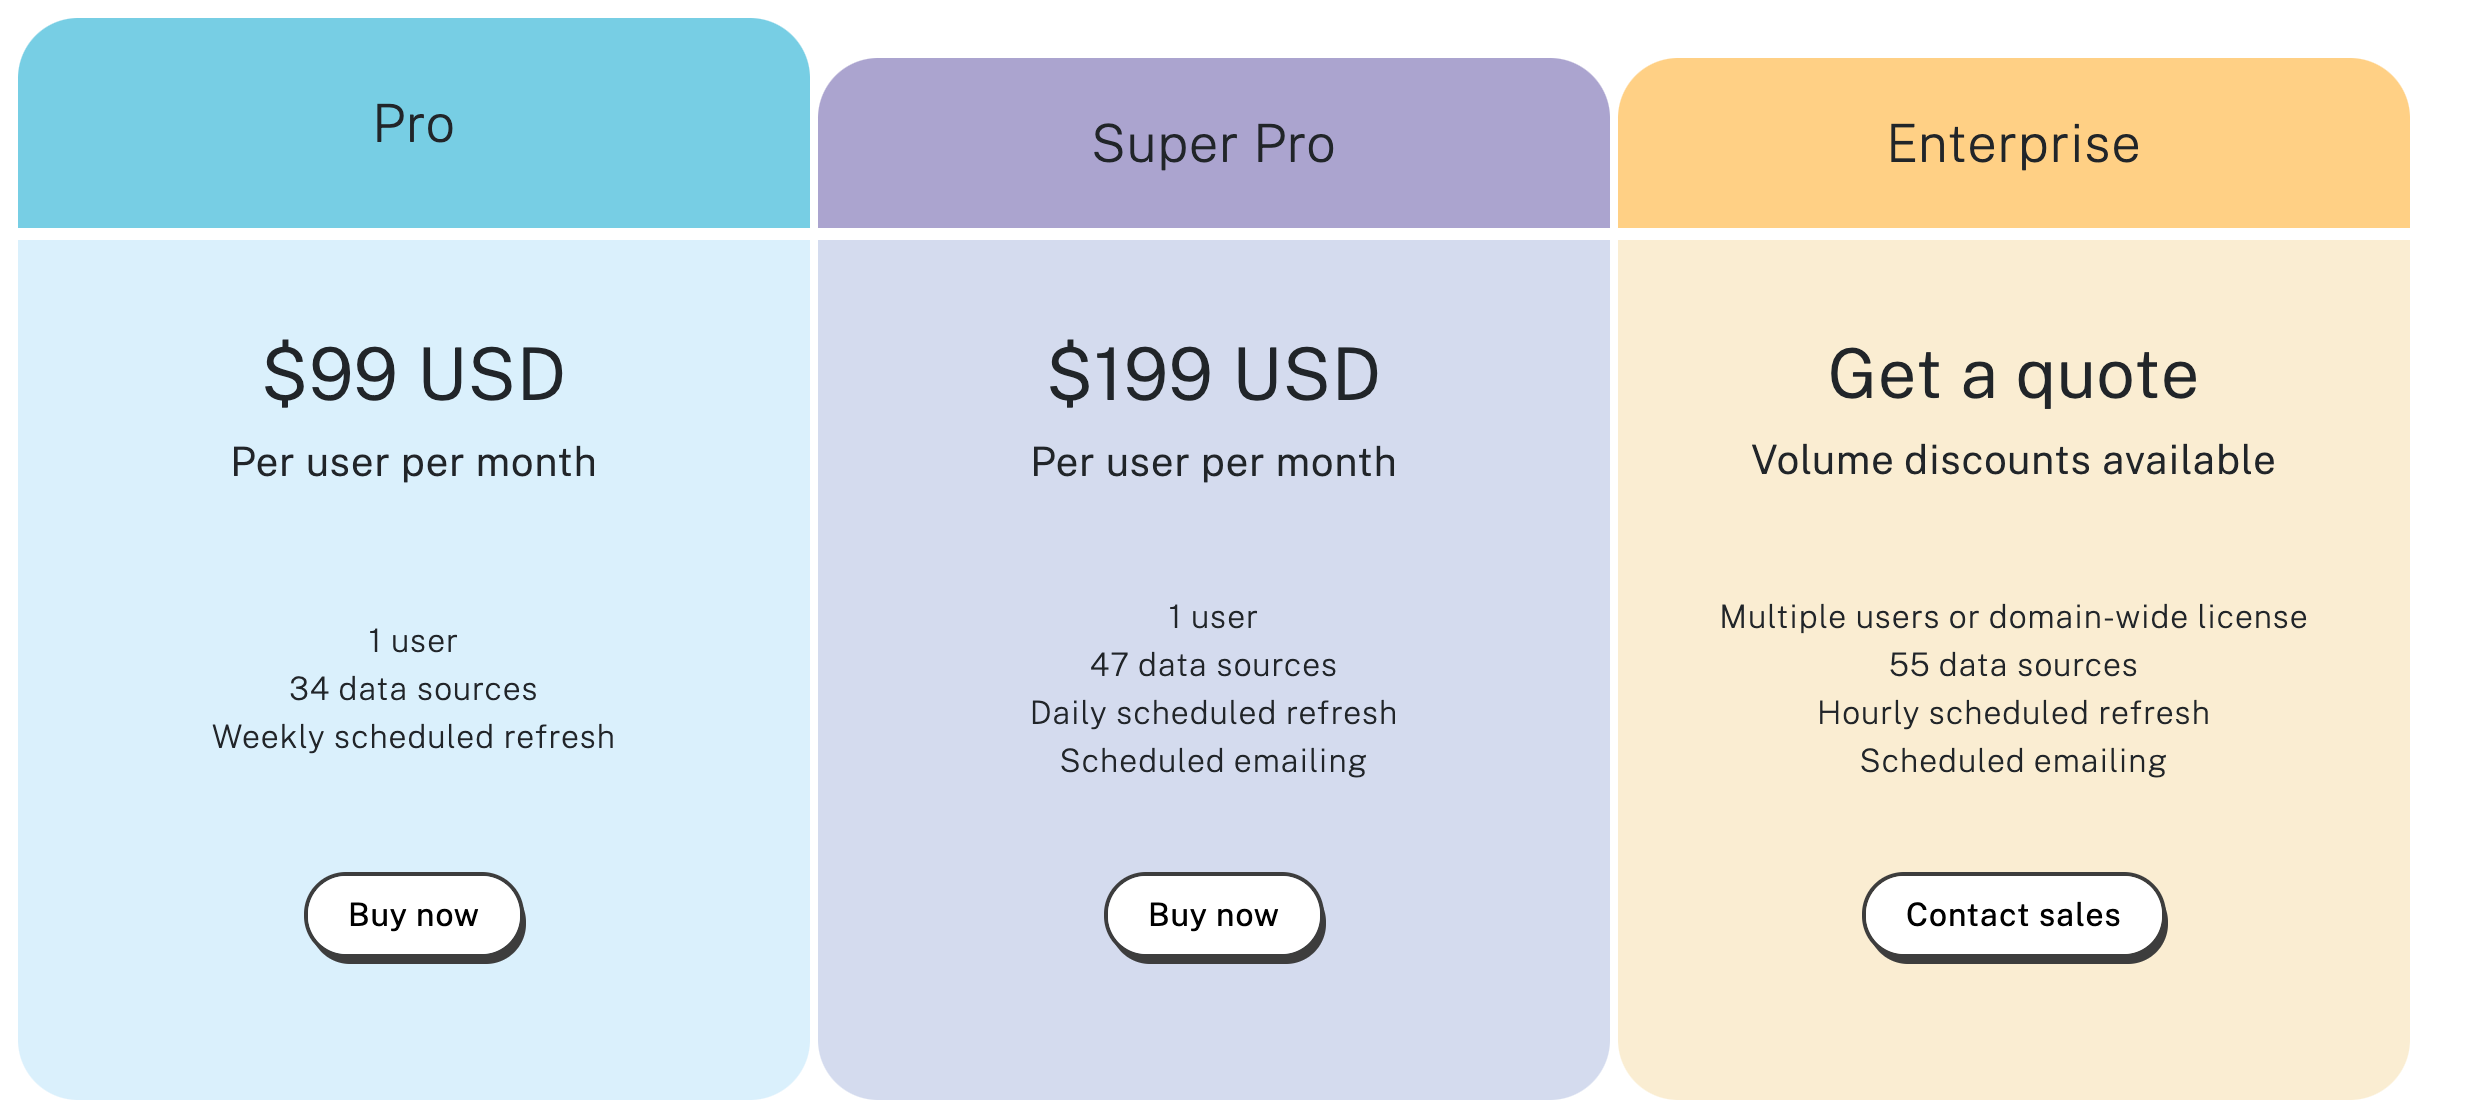
We use the Super Pro plan because it allows us to open our Google Sheets every day to see the latest data.
If you use Supermetrics for Google Data Studio, they have a cheaper option starting at $39.
The whole point of Supermetrics is to allow you to go into one simple dashboard to view all of your metrics at once, rather than going into the platforms themselves.
LinkedIn, Facebook, and Google Ads can all be slow, so seeing the data pulled in for you already when you open the document is a great time saver.
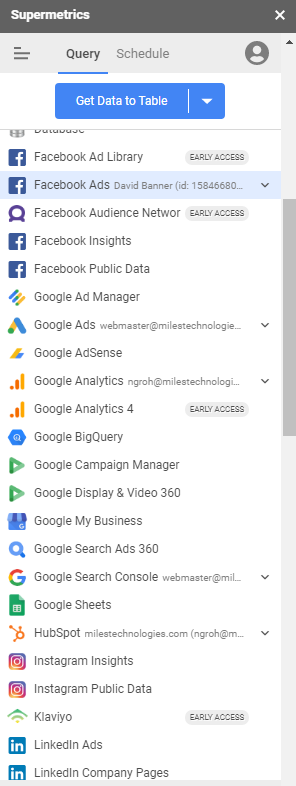
What integrations are there for Supermetrics?
There are a ton of valuable integrations you can access to show your data to your clients or boss.
I’ve found the most useful to be:
- Google Ads
- Google Analytics
- Google Search Console
- Facebook Ads
- Linkedin Ads
- Hubspot
- Callrail
If you’re doing native advertising, there’s an integration for Outbrain.
Have an ecommerce store? There’s a Shopify and Stripe integration.
Are you A/B testing? You can sync up with the Optimizely integration. Unfortunately, the free Google Optimize is not currently available as an integration.
SuperMetrics Alternatives
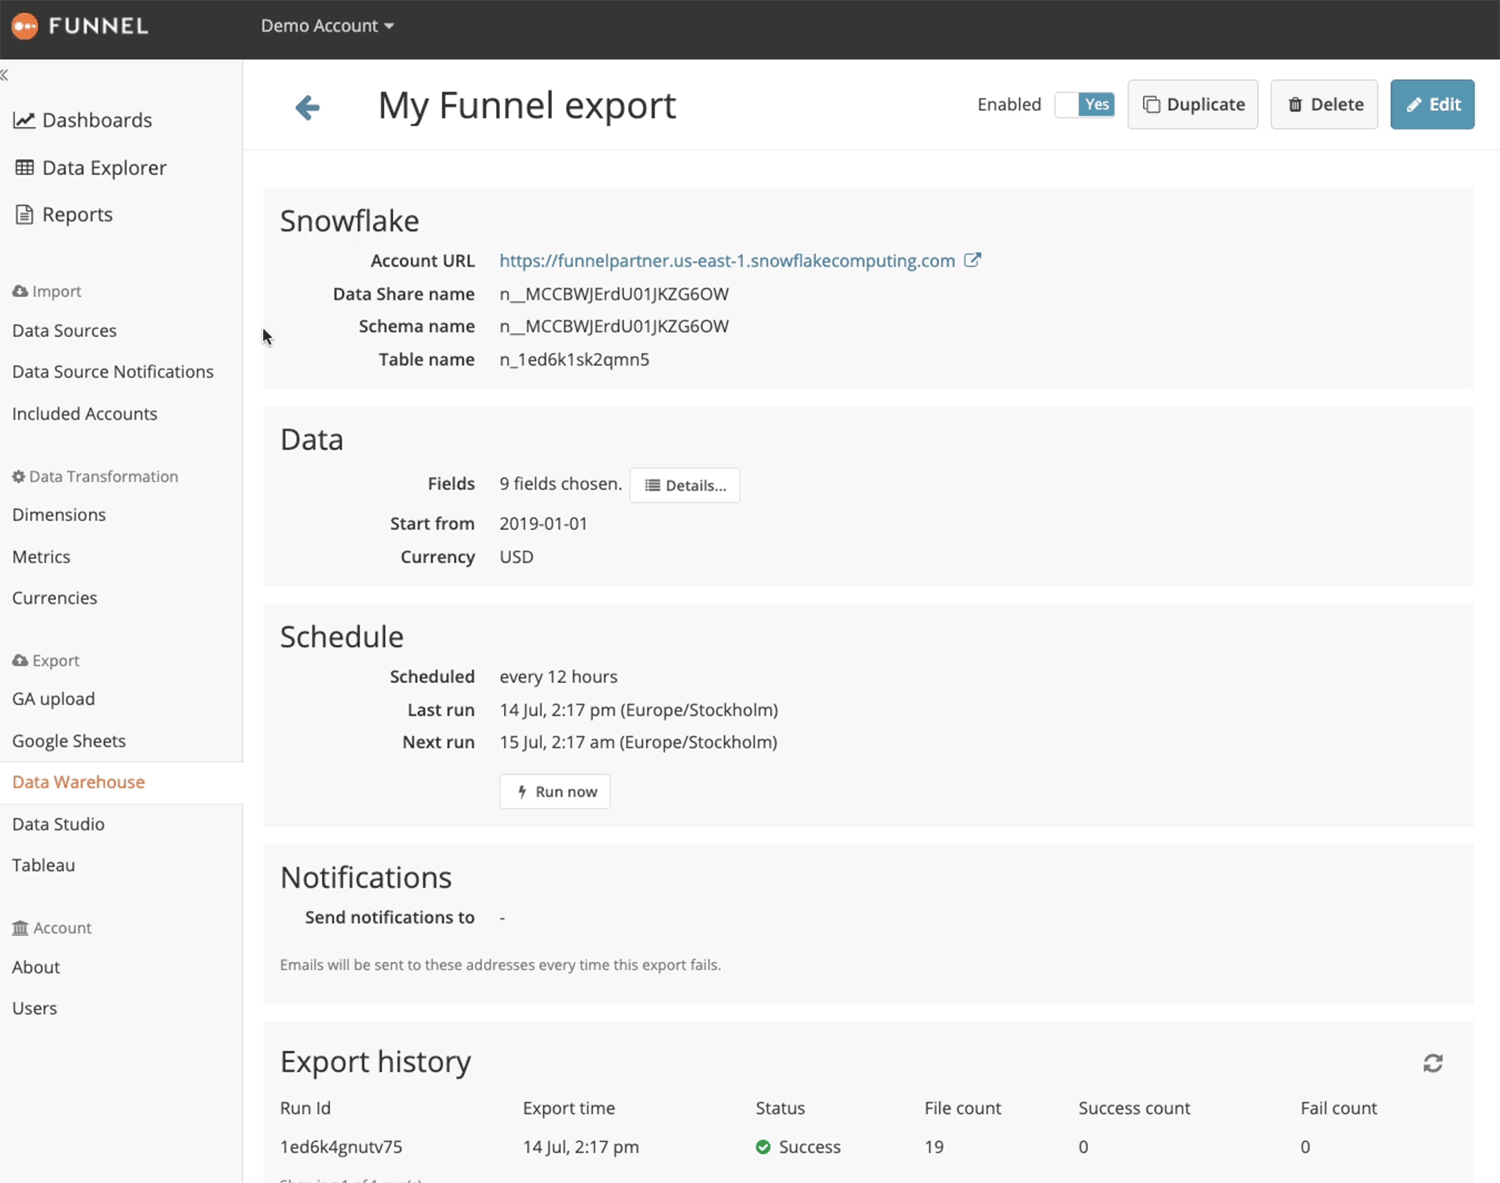
Funnel.io
Funnel.io is a more expensive solution that accomplishes the same things as Supermetrics.
However, the interface requires a lot more learning to be able to utilize fully. It’s not nearly as intuitive as most data visualization tools.
For the price, it’s better to start with something more straightforward to accomplish your goals.
DashThis
We have been primarily using DashThis for a few years now. While the reporting is excellent for most of our customers, some customers just need a more robust solution.
Being able to pull in data from Callrail, Google Ads, Facebook, etc., was the main reason we use them.
They are absolutely a great solution if you want visual reports for your customers.
If you’re looking for something more custom, Supermetrics is the way to go because you can really have the data look any way you want.
Conclusion
Supermetrics has been super valuable for us so far in just a short time of using it. It helps us highlight data points that we might not have been aware of before.
We often use Supermetrics as a jumping-off point to dive further into an issue we may be seeing. It’s been helpful for us to see where we should focus our efforts.